
Pillar 1: Basics of Option Chain Analysis
Welcome to the inaugural post of our 10-part series, “Mastering the Chain: A Comprehensive Guide to Option Chain Analysis.” In this series, we will transition from the foundational mechanics of the derivative markets to high-level institutional strategies. Today, we start from the very beginning: the Option Chain. Think of it as Market GPS that reveals the hidden paths the institutional ‘Big Money’ is taking and not a list of numbers.
The "Why": The Institutional Map for Disciplined Traders
Many retail traders spend more time selecting a restaurant for dinner than they do studying the option chain. At Suvinu Credence, we view the option chain as the most critical screen in derivative trading. It is not merely a list of prices; it is a real-time heat map showing where the “Big Money”—institutional option sellers—have placed their bets.
Option sellers, who typically represent institutional desks and high-net-worth individuals, require significant margin to write contracts. Because their risk is theoretically higher, they are generally more disciplined and better informed than the average buyer. By learning to read the chain, you are learning to read the intentions of the market’s primary liquidity providers.
What is an Option Chain and Why Does it Matter in the Indian Market?
An option chain, also known as an option matrix, is a comprehensive listing of all available option contracts for a specific underlying asset, such as the Nifty 50, Bank Nifty, or FinNifty. It provides a structured view of all strike prices for a given expiry date, allowing traders to evaluate premiums, liquidity, and institutional positioning at a glance.
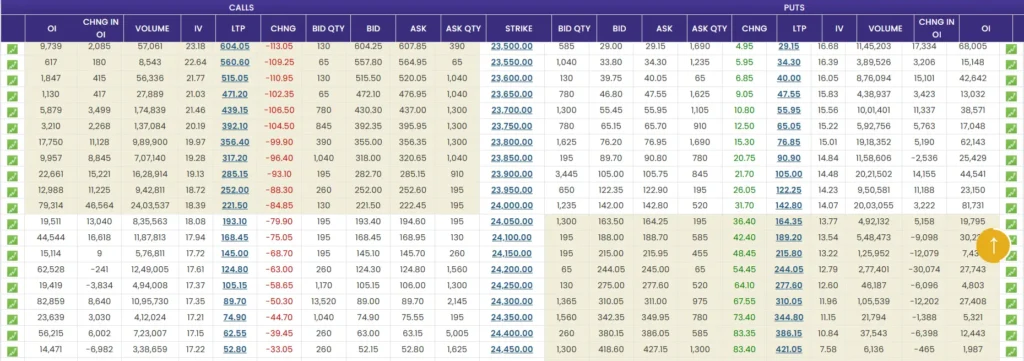
Detailed NSE Option Chain Layout
The National Stock Exchange (NSE) provides a standardized layout that acts as the industry benchmark for Indian traders. Rapidly processing this data requires an understanding of its physical structure:
- The Center Column (Strike Price): This is the heart of the matrix, listing the predetermined prices at which the index can be bought or sold.
- The Left Side (Calls): All data columns to the left of the strike price refer to Call Options.
The Right Side (Puts): All data columns to the right of the strike price refer to Put Options.
Visual Shading (Moneyness) and Pricing Components
On the NSE layout, you will notice specific rows are shaded (typically in yellow), while others remain unshaded (white). This distinction is based on Moneyness, which categorizes options by their relationship to the current market (spot) price.
1. In-the-Money (ITM) - Shaded Regions
- Why they are called ITM: These contracts are “in the money” because they have already captured real value. For a Call, the index is already above the strike; for a Put, the index is already below it.
- Pricing Component: These premiums consist of Intrinsic Value plus Time Value. Intrinsic value is the tangible profit that could be realized if the option were exercised immediately (e.g., if Bank Nifty is at 47,000, a 46,500 Call has 500 points of intrinsic value).
- Significance: Institutional sellers view ITM options as high-risk, high-reward instruments because their price sensitivity approaches 1.0, making them behave almost like futures contracts.
2. Out-of-the-Money (OTM) - Unshaded Regions
- Why they are called OTM: These contracts are “outside” the money. The index has not yet reached these strike prices.
- Pricing Component: These premiums have Zero Intrinsic Value. Their entire price is composed of Time Value (or “Extrinsic Value”), which represents the market’s expectation that the index might reach that level before expiry.
- The Nature of Time Value: It is critical to understand that Time Value is not static; it varies at every instance. With every passing second, the contract draws closer to its expiry date and time. This constant progression reduces the mathematical probability of the option becoming “valuable” (reaching the strike) by expiry. Consequently, the premium “bleeds” continuously through Theta Decay.
- Significance: These are the primary tools for option sellers. Because they consist only of time value, sellers aim to profit from the daily “rent” the buyer pays, which eventually evaporates if the market stays still.
💡 Did You Know? Time Value is essentially the ‘Insurance Premium’ that a buyer pays a seller. As an option seller, your goal is to collect this premium as it slowly evaporates every day.
3. At-the-Money (ATM)
- Why they are called ATM: This is the strike price sitting exactly at, or closest to, the current market spot price.
- Pricing Component: These contain the maximum amount of Time Value and are the most sensitive to the acceleration of time decay as expiry approaches.
- Significance: ATM strikes are the “battlegrounds” where institutional activity and volume are usually most intense.
How to Interpret NSE Option Chain Data: OI, Volume, and Greeks?
Types of Options: The Seller's Perspective
Each side of the matrix is organized into several key columns that provide institutional “breadcrumbs” for our analysis:
- Open Interest (OI): The total number of outstanding contracts that have not yet been settled or closed. High OI at a specific strike indicates a significant “wall” of interest.
- Change in OI: One of the most vital metrics, showing the net addition or liquidation of contracts during the current session. It reveals where the “Big Money” is actively moving its capital today.
- Volume: The total number of contracts traded during a specific period. High volume combined with rising OI signals strong institutional conviction.
- LTP (Last Traded Price): The current market premium for the option contract.
- Change in Price: The real-time fluctuation in the premium’s value, indicating immediate market momentum.
- Delta (Price Sensitivity): A metric that measures how much the option premium changes for every 1-point move in the underlying index.
- Average Price: A benchmark for where the majority of trades were executed during the session, helping traders spot entries that may be “over-extended” from the mean.
- Bid and Ask: The Bid is the highest price a buyer is willing to pay, while the Ask is the lowest price a seller is willing to accept.
While retail traders often view options as directional bets, professional sellers view them as insurance contracts they are underwriting.
- Call Options: For a seller, a call option is a commitment to deliver the index if it rises above the strike. Institutional sellers write calls at levels they believe act as Resistance.
- Put Options: For a seller, a put option is a commitment to support the index if it falls. Large clusters of Put OI often act as Support or a floor for the market.
The level where the highest number of calls and puts would expire worthless is known as Max Pain. Markets often gravitate toward this level as expiry approaches because it is the point where option sellers—the “Big Money”—lose the least amount of capital.
How to Read an Option Chain
To read the chain like an institutional strategist, you must look past individual prices and focus on the supply-demand dynamics of the contracts:
- Identify OI Clusters: Search for strikes with disproportionately high Open Interest. A “Put Wall” at a lower strike suggests institutional confidence in a market floor, while a “Call Wall” at a higher strike suggests a ceiling.
- Analyze the Bid-Ask Spread: Tight spreads (low difference between Bid and Ask) indicate high liquidity. A wide spread signals higher “slippage” costs, meaning it will be more expensive to enter or exit your position.
Spot the “Battleground”: The ATM strike is where institutional activity is usually most intense, as buyers and sellers fight for control of the immediate trend.
Practical Takeaway: The Pro-Tip
The Pitfall: Many retail traders look only at the total Open Interest (OI) to determine support and resistance levels. The Pro-Tip: Always monitor OI Change alongside Volume. Total OI tells you where the walls were built; OI Change and Volume tell you where the “Big Money” is moving now. If you see a sharp decline in Put OI at a support level accompanied by rising volume, it may signal that institutional sellers are “unwinding” their positions because they expect the support to break.
This is Part 1 of our 10-part series on Option Chain Analysis. Stay tuned for our next post where we dive into Pillar 2: Option Greeks.
At Suvinu Credence, we believe that data-backed discipline is the key to long-term wealth. Explore our services to see how we simplify complex market data for your trading journey