Pillar 4: Implied Volatility and IV Rank – The Market’s "Fear Gauge"

Synthetic IV

In our previous post, we mapped the institutional battlefield by identifying key levels of support and resistance. We learned that Open Interest (OI) clusters act as “walls” that the “Big Money” is mathematically incentivized to defend. However, knowing where the walls are is only half the battle. To trade with true institutional discipline, you must understand the “Climate” of the market—quantified by Implied Volatility (IV) and its comparative metric, IV Rank. Today, we dissect how volatility dictates the price of “insurance” in the Nifty and Bank Nifty markets.

The “Why”: The Institutional Compass for Premium Pricing

Option premiums should not be viewed as simple prices; they should be treated as the cost of insurance. For a disciplined institutional seller, Implied Volatility (IV) is the single most important variable for determining whether they are paid enough to take on risk. While retail traders often focus solely on the direction of the index, professional writers use IV to gauge if premiums are “overpriced” (high fear) or “underpriced” (market complacency). Understanding this “fear premium” allows you to enter trades when the odds of Theta Decay are overwhelmingly in your favor.

Understanding Implied Volatility (IV)

Implied Volatility (IV) represents the market’s collective expectation of future price swings over the next 30 days. Unlike historical volatility, which looks at the past, IV is forward-looking and is derived directly from current option prices.

  • The Fear Gauge: High IV signals that traders are bracing for significant moves or uncertainty, causing option premiums to inflate regardless of where the index is trading.

India VIX and Implied Volatility (IV) has the same difference as that between the “overall weather” and the “micro-climate” of a specific coordinate. While both measure fear and expected price swings, they serve different functions for a disciplined institutional strategist.

1.India VIX: The Macro "Fear Gauge"

The India VIX is a broad index that measures the market’s expectation of volatility for the Nifty 50 over the next 30 days.

  • The Benchmark: It is calculated based on the order book of Nifty options.
  • Market Sentiment: It reflects collective sentiment: a low VIX signals a calm, stable market, while a high VIX (above 25) indicates panic or intense uncertainty.
  • Inverse Correlation: Historically, when India VIX spikes, the Nifty 50 tends to fall, as seen during the 2020 crash when VIX surged +155% and Nifty plunged nearly 23%.
    • VIX Below 15: Calm, stable markets with gradual trends.
    • 15–25: The “Uncertainty Zone”—typical during news-driven regimes or geopolitical tensions.

Above 25: The “Panic Zone”—characterized by sharp corrections and aggressive selloffs.

2. Implied Volatility (IV): The Micro-Climate

Unlike the India VIX, which represents the entire index, Implied Volatility (IV) is specific to each individual option contract within the option chain.

  • Strike-Specific: Each strike price (e.g., Nifty 24,000 Call vs. 24,500 Call) has its own IV.
  • Expectation Component: IV is the market’s expectation of price swings for that specific contract, derived directly from the current market premium.
  • Cost of Insurance: For institutional sellers, IV represents the “fear premium” baked into that specific contract’s price.

Modern trading platforms and the NSE Option Chain provide these values in real-time. Most strategists focus on the IV of At-the-Money (ATM) options, as these strikes are the most sensitive to immediate shifts in sentiment.

3. How to Calculate Implied Volatility (IV)

While modern trading platforms provide these values in real-time, understanding the mechanics behind the math is essential for a disciplined strategist to identify overvalued or undervalued premiums.

As mentioned earlier, Implied Volatility is forward-looking and is derived directly from the current market premium of an option.

  • The Mechanism: IV is calculated by using an option pricing model (such as Black-Scholes) in reverse. Instead of inputting volatility to find the price, you input the option’s current market price (LTP) alongside known variables like the underlying index price, strike price, time to expiry, and interest rates to solve for the “implied” volatility [345, Conversation History].

Micro-Climate Metric: It is important to note that IV is granular; every strike price and expiry date in the Nifty or Bank Nifty option chain has its own unique IV.

4. Which One Determines Option Pricing?

While the India VIX sets the general tone for the market, Implied Volatility (IV) is the metric that directly determines option pricing.

  • Pricing Input: In option pricing models, IV is the variable that accounts for the expected movement of the underlying asset.
  • The Vega Factor: The Greek Vega measures the sensitivity of an option’s premium to a 1% change in IV7more_horiz. If the IV of a specific Bank Nifty 48,000 Call rises by 1%, the premium will increase by the amount of its Vega value, even if the index price remains unchanged.
  • IV Crush: Institutional sellers thrive on the IV Crush—a rapid drop in IV immediately after a major event, which causes premiums to collapse regardless of where the India VIX index sits.

Summary of Differences

Feature

India VIX

Implied Volatility (IV)

Scope

Broad (Nifty 50 Index)

Granular (Specific Strike/Expiry)

Calculation

Based on Nifty option prices

Derived from an individual option’s current premium

Role in Pricing

Indicates broad sentiment

Direct input for calculating premium and Vega

Institutional Use

Gauging market-wide fear regimes

Identifying overvalued or undervalued premiums via IV Rank

5. Impact of IV on Option Pricing and Strategies

The Greek that quantifies volatility risk is Vega. Think of Vega as “volatility sensitivity”,it tells you how much the premium will change for every 1% shift in IV.

  • Premium Expansion: When IV spikes (rising India VIX), both Call and Put premiums increase. For example, if an option has a Vega of 12, a 1% rise in IV will theoretically add ₹12 to the premium, even if the index stays flat.
  • The “IV Crush”: This is a rapid collapse in IV that occurs immediately after a major event (e.g., Union Budget or RBI Policy)3more_horiz. When uncertainty is resolved, the “fear premium” evaporates, causing option prices to plummet.

Strategies for Varying Volatility Environments

Institutional-grade strategists adapt their “playbook” based on the IV regime:

  1. High IV Environment (The Seller’s Market)

When IV is high, institutions sell volatility to harvest inflated premiums.

  • Strategies: Short Straddles, Short Strangles, or Iron Condors.
  • Goal: Profit from Theta Decay and the eventual IV Crush.
  1. Low IV Environment (The Buyer’s Market)

When IV is low, insurance is cheap. This is a hazardous time to be a “naked” seller, as any sudden news can cause a Vega spike that wipes out your capital.

  • Strategies: Long Straddles (before major events) or Debit Spreads.

Goal: Protect capital against “Black Swan” events while waiting for volatility to expand.

IV Skew, IV Rank, IV Percentile and their Significance

1. What does IV Skew Actually Means

In standard financial theory—such as the Black-Scholes model—all options on the same underlying asset with the same expiration date are assumed to have the exact same implied volatility (IV). In reality, they do not.

Rather than being an anomaly or a temporary deviation from the norm, IV skew is this baseline market structure that describes the standard and permanent pattern by which implied volatility naturally varies across different strike prices for options sharing the same expiration date.

While At-the-Money (ATM) IV tells you the general cost of insurance, the skew reveals how fear is distributed across different strike prices. Identifying this skew is critical for institutional-grade strategists to determine whether the “Big Money” is paying a premium for crash protection or bracing for an explosive upside rally.

The most common way to identify skew in the is to look at Out-of-the-Money (OTM) strikes

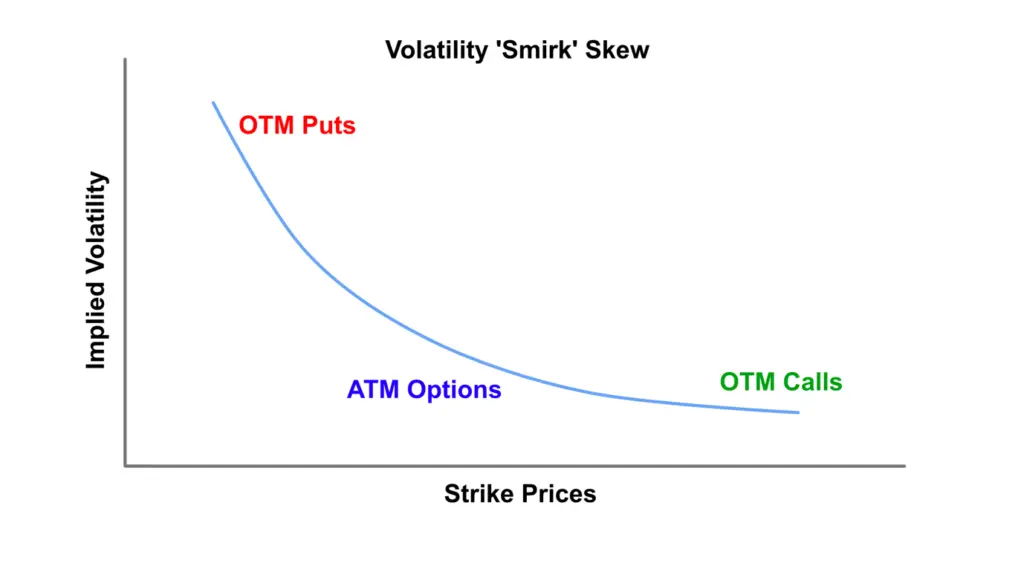
1.The "Smirk" (Downside Skew):

  • Compare the IV of a Put that is 5% below the current spot price to a Call that is 5% above.
  • Identification: If the OTM Put IV is significantly higher than the OTM Call IV, the market is exhibiting a Reverse Skew or “Smirk”.
  • A volatility smirk occurs when the market tilts heavily toward one side. In equity markets, the smirk is almost always downward-sloping.
  • The Psychology: Investors suffer from “crash phobia.” Because stock markets tend to drop much faster than they rise, portfolio managers aggressively buy OTM puts to protect their long positions against a market crash.
  • The Result: This massive demand drives up the price (and IV) of low-strike OTM puts, making the left side of the chart look like a steep cliff, while higher-strike OTM calls remain relatively flat or lower in IV

Institutional Context: In May 2026, geopolitical shocks in West Asia manifested as a sharp downside skew where OTM Puts became significantly more expensive than OTM Calls. This indicates that institutional players are aggressively buying Puts to hedge against “Black Swan” events, making downside protection more costly than upside speculation.

2. Analyze the "Volatility Smile"

By observing how IV changes as you move away from the ATM strike, you can identify the “shape” of the volatility:

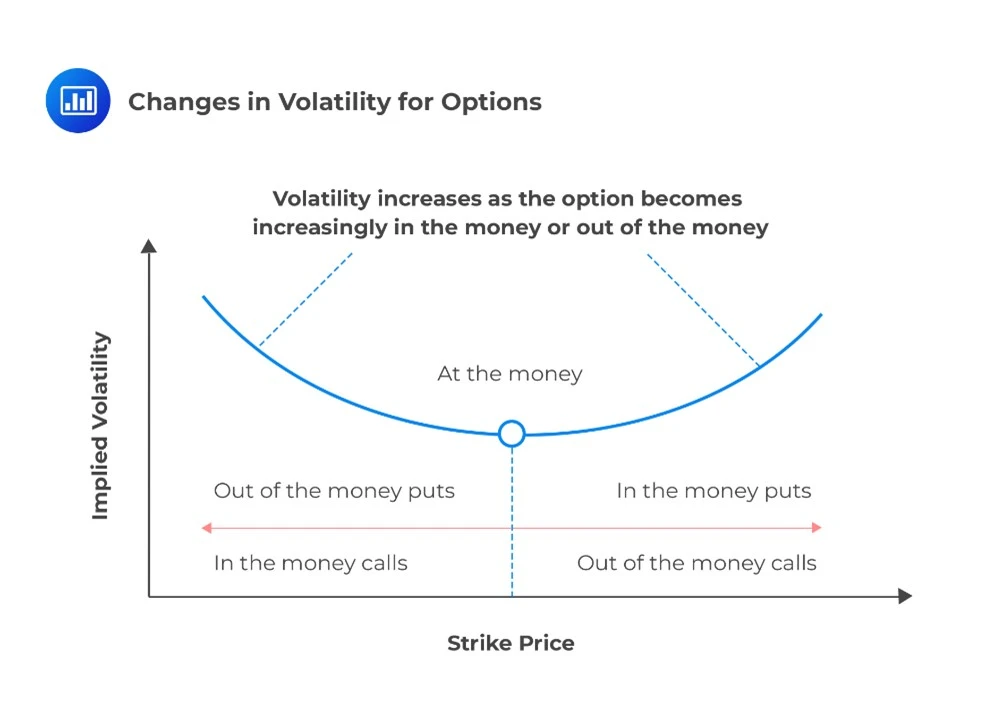
  • ATM Anchor: Typically, the ATM strike (closest to the spot price) has the lowest IV in the chain.
  • The Curve: If you notice IV increasing steadily as you move into either In-the-Money (ITM) or OTM strikes on both sides, you have identified a Volatility Smile.

The Signal: A steeper smile indicates that the market is pricing in a higher probability of extreme, “outlier” moves rather than a standard bell-curve distribution.

A true volatility smile means that deep out-of-the-money (OTM) puts and deep OTM calls are both highly valued.

  • The Psychology: Investors expect high volatility but are genuinely uncertain about the direction. For example, in currency markets, the currency is just as likely to experience a massive sudden jump as likely it is to experience a massive crash.

Here is a direct comparison of the two:

Feature

🔗 Volatility Smile

📉 Volatility Smirk (Skew)

Shape

Symmetrical U-shape. IV rises relatively equally in both directions away from the current stock price.

Asymmetrical curve. One side is significantly steeper than the other (usually sloping downward from left to right).

Market Bias

The market perceives an equal probability of extreme upward or downward price moves.

The market is heavily worried about a crash in one direction (usually a massive downward move).

Common Assets

Foreign Exchange (FX) options and short-term equity options before major news events (like earnings).

Equity markets (like the Nifty 50 index options) and individual stock options.

3. Spotting Event-Driven Skew

IV skews are dynamic and often widen significantly ahead of scheduled catalysts.

  • Pre-Event Widening: Ahead of major events like the Union Budget, RBI Policy statements, or Fed meetings, the IV skew typically expands.

Identification: Look for a sudden spike in the IV of “wing” strikes (extreme OTM) relative to the ATM IV. This signals that traders are “panic-buying” protection to mitigate the risk of gap openings following the event.

What is IV Rank (IVR) and how is it Calculated

IV Rank is a comparative tool used by institutional sellers to determine if current premiums are “expensive” or “cheap” relative to their own historical performance over a specific period, typically the last 52 weeks.

If Nifty IV is 20, is that high or low? If the IV has ranged between 10 and 30 over the past year, an IV of 20 results in an IV Rank of 50%.

For an option seller, the IV Rank is often more useful than the raw IV number. We generally look for an IV Rank above 70% to identify a “Seller’s Market”. This signals that fear is near a yearly peak, inflating premiums and creating an ideal environment to harvest Theta Decay and profit from an eventual IV Crush once market uncertainty resolves.

When the IV Rank climbs above 70%, institutional desks view the market as being in a high-fear regime.

  • The Mispricing: Option premiums become inflated because traders are overpaying for “insurance” due to perceived event risk or panic.
  • Actionable Signal: This is an ideal environment for Option Sellers. The high IV Rank signals that you are collecting a significant “fear premium.” Professional desks use this to execute strategies like Short Straddles, Short Strangles, or Iron Condors.
  • The Goal: To harvest rapid Theta Decay and profit from the eventual IV Crush—the collapse in premium that occurs once the market uncertainty resolves.

Conversely, a low IV Rank (below 30%) indicates a “Buyer’s Market,” where selling “insurance” is hazardous because a sudden Vega spike (expansion in volatility) can rapidly inflate premiums and wipe out capital.

An IV Rank below 30% suggests a market of extreme complacency or “cheap insurance”.

  • The Mispricing: Options are underpriced relative to their historical volatility range. The “rent” (premium) you receive as a seller is likely not enough to justify the risk of a sudden move.
  • Actionable Signal: This is a hazardous time for “naked” option sellers. Instead, institutional traders look for Option Buying opportunities, such as Long Straddles or Debit Spreads, ahead of scheduled catalysts like RBI Policy or the Union Budget.

The Goal: To profit from a Vega spike (volatility expansion) where the premium increases even if the underlying index stays flat

To calculate IV Rank, you need the current IV and the high/low IV values from the past year:


Practical Example:

If you are looking at a Nifty 24,000 Call and the current ATM IV is 20, you must look at its range over the last year to interpret that value.

  • Scenario A (High IVR): If the 52-week low was 10 and the high was 25:


  Scenario B (Medium IVR): If the 52-week low was 10 and the high was 30:


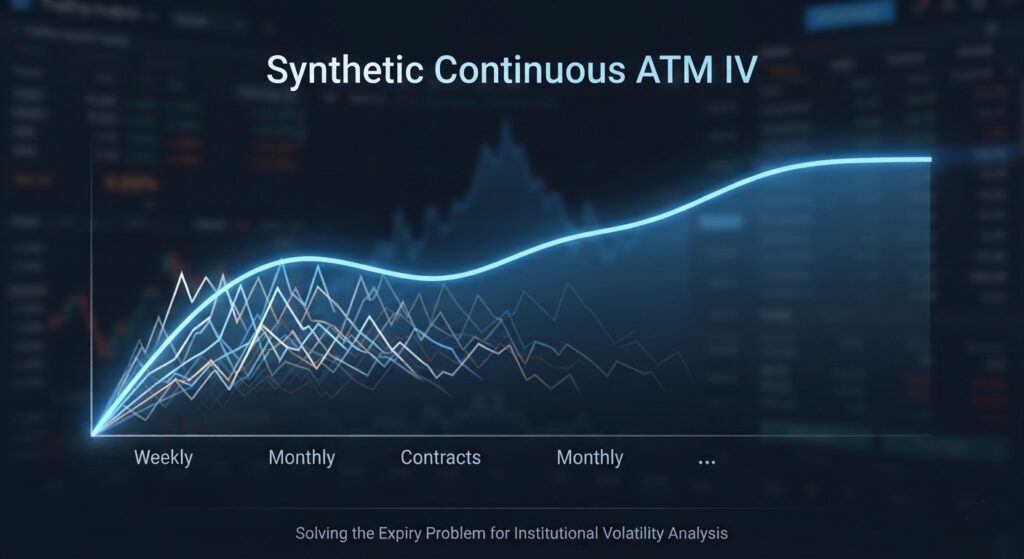
Individual option contracts have short lifespans—expiring weekly or monthly—which prevents them from providing a long-term historical record of volatility. To overcome this “expiry problem,” professional strategists and institutional data platforms track a Synthetic Continuous At-the-Money (ATM) Implied Volatility (IV) data series.

This specialized series establishes a consistent 52-week range by continuously tracking the implied volatility of whichever option strike is currently ATM throughout the year. Institutional trading desks then utilize this continuous data series to calculate accurate IV Rank metrics for the underlying index.

Stitching Individual Data into a “Continuous” Series

  • front-Month Focus: Professional data platforms typically track the IV of the ATM strike of the nearest (front-month) contract.
  • The “Roll” Mechanism: As a contract reaches its expiry date—such as the last Tuesday of the month for Nifty—the calculation automatically “rolls” or shifts its focus to the ATM strike of the next liquid contract.
  • Resulting Series: This creates an uninterrupted, year-round historical timeline of what the market’s “fear premium” was for whichever strike was currently At-the-Money throughout the year.

Once this continuous data series is built, you can identify the 52-week High IV and 52-week Low IV. These two boundary points are the essential variables for the IV Rank formula:

Modern institutional-grade tools and many Indian retail platforms aggregate this data automatically. While the official NSE chain shows current IV for every strike, historical high/low ranges for that IV are typically found in the “Historical Volatility” or “Implied Volatility” charting sections of professional brokerage tools

IV Percentile (The Time-Relative Lens)

 IV Percentile is a critical tool for scanning for volatility mispricing. Based on standard institutional trading practices, IV Percentile measures the percentage of time the IV has traded below the current level over the lookback period.

  • The Question it Answers: “What percentage of the last 252 trading days or 52 weeks was the IV lower than it is today?”
  • The Calculation (Institutional Standard): It counts the number of days the IV was lower than the current value and divides that by the total number of trading days in the period.
  • The Advantage: It is less affected by “outlier” spikes. For example, if Nifty IV spiked to 80 for just one day during a crash but otherwise stayed between 15 and 25, the IV Rank would remain very low (due to the 80 high), but the IV Percentile would correctly show that current IV is high relative to its usual behavior.


In our previous section we discussed the role of IV RANK in spotting mispricing of option premiums. A critical step in doing is to ensure that the IV Rank isn’t being distorted by a single “Black Swan” event, such as the 2020 crash, which could keep the 52-week high artificially elevated.

  • The Institutional Standard: Always cross-reference IV Rank with IV Percentile.
    • If IV Rank is only 30% but IV Percentile is 85%, it tells you the IV is high relative to its usual behavior, even if it hasn’t reached its absolute yearly peak.
    • Interpretation: This confirms that options are actually “expensive” and ripe for selling, despite what a low IV Rank alone might suggest.


Comparison Summary

Metric

Calculation Focus

Sensitivity

IV Rank

The absolute high/low range of the past year [Conversation History].

Highly sensitive to one-day extreme spikes (outliers).

IV Percentile

The frequency of occurrences over the past year [Source 472].

Provides a “normalized” view by focusing on where IV spent most of its time.

The Pro-Tip:

  1. Retail traders often sell options just before a major event because premiums look “juicy.” They frequently get stopped out by a Vega spike (rising VIX) in the minutes leading up to the announcement, even if their directional view is correct. Professional institutional desks wait for the VIX to peak or for the event outcome to begin resolving before “harvesting” the IV Crush.
  1. Retail traders often see high IV in OTM Puts and assume the market is about to crash. High Put IV (downside skew) simply means insurance is expensive, not that a crash is guaranteed. For an option seller, a steep downside skew often presents an opportunity to execute Credit Spreads or Iron Condors. By selling the “high IV” OTM Put and buying a further OTM Put as protection, you are essentially harvesting the “fear premium” created by the skew
  1. Do not trade a specific strike based only on the India VIX. While VIX might be 18, the IV of a specific Out-of-the-Money (OTM) Put could be 25 due to a “volatility skew”15. Professional sellers always look at the IV Rank of the specific contract to ensure they are collecting enough “rent” (premium) for the risk being underwritten.
  1. Many traders try to find a “52-week high” for a specific option premium. This is impossible because of Theta Decay, which eventually forces all option prices toward zero at expiry. Always focus on the Volatility Range (IV), not the price range.
  1. Entering a short position based on “high” raw IV without checking the IV Rank and IV Percentile could result in a disastrous trade.

For example, Nifty IV at 25 might look high, but if the yearly range is 20–50, an IV of 25 is actually at the lower end of its range (IV Rank of ~16%), making it a dangerous time to sell. Never underwrite risk (sell options) unless the IV Rank is at an extreme.

If IV Rank is only 30% but IV Percentile is 85%, it tells you the IV is high relative to its usual behavior, even if it hasn’t reached its absolute yearly peak. The IV Rank might be having a lower value due to IV distortion caused by a black Swan Event


This is Part 4 of our 10-part series on Option Chain Analysis. Stay tuned for our next post, Pillar 5: Interpreting Option Chain Data, where we synthesize OI, Volume, and Greeks into a cohesive trading plan.

At Suvinu Credence, we believe that data-backed discipline is the key to long-term wealth. Explore our services to see how we simplify complex market data for your trading journey.

Leave a Comment

Your email address will not be published. Required fields are marked *

Scroll to Top