
Pillar 3: Identifying Key Levels in Option Chains
Institutional Risk Map Legend
In our previous post, we explored the “Radar” of the market: the Option Greeks. We learned how Delta acts as a measure of price sensitivity and how Theta Decay serves as the primary income engine for institutional sellers. However, knowing how fast a premium moves is only half the battle. To trade with the discipline of the “Big Money,” you must identify where the market is likely to stall, reverse, or accelerate. Today, we dive into the “Map”: identifying key support and resistance levels through option chain analysis.
The "Why": Mapping the Institutional Battlefield
Many retail traders treat the option chain like a passive scorecard, however in reality it is a real-time risk map. On the other hand option sellers typically represent institutional desks and high-net-worth individuals. Writing or selling options require significant margin—often exceeding ₹1 Lakh per lot in indices like Nifty 50 or Bank Nifty. As their risk profile is theoretically unlimited, they are highly informed, well – capitalised and do not place bets randomly. When such institutional writers sell a specific strike price in massive quantities, they are effectively building a “wall” to protect their capital, which they are prepared to financially defend.
If you are a directional trader, knowing where these institutional walls are built is a structural requirement. It ensures you do not inadvertently buy a call option directly into a major resistance wall or short the market directly into a fortified structural floor.
Core Analysis: The Structural Mechanics of Support and Resistance
To identify key levels with institutional precision, we must dissect support and resistance through distinct layers of time and liquidity: positional Open Interest, intraday Volume distribution, and intraday Change in Open Interest (COI)
1. Concept of Support and Resistance in Option Chains
In technical analysis, support and resistance are often drawn from historical price action. In the option chain, these levels are dynamic and forward-looking, based on the positioning of sellers:
Resistance (Call Walls): Strikes with the highest Open Interest (OI) on the Call side act as resistance. Institutional sellers write these calls because they believe the index (Nifty or Bank Nifty) will stay below that level. They will actively defend these strikes by selling more if the market rallies toward them.
Support (Put Walls): Strikes with the highest Put OI act as support. Sellers of these puts are betting the market will stay above these levels, effectively creating a floor for the index.
2. Identifying Key Levels Using Open Interest, Volume, and Change in Open Interest (COI)
To find these levels on the NSE option chain, we look for institutional footprints provided by two metrics:
- Open Interest (OI): This represents the total number of outstanding contracts. A massive cluster of cumulative OI at a specific strike indicates a high-conviction “Battleground” where positional capital has concentrated its risk over days or weeks.
- Volume: in addition to the Support and Resistance levels drawn out by OI, during an intraday session highest Volume at a certain strike price also creates a support or resistance level for that session. Because volume resets to zero at the start of every trading day, it reveals the active fighting taking place at those walls in real-time. These build up of volumes could be at the same levels as that created by OI earlier or could be strike price different from that of OI levels.
- Change in OI (COI): is the primary metric for tracking current institutional intent. A strike with high COI acts as an immediate or temporary hurdle that can hold the market from proceeding toward the larger Total OI or high volume levels (walls). In a downward movement, the underlying script tends to find support (stop) at strikes where Put OI is greater than Call OI, as Put sellers are betting the index will stay above those levels. Conversely, in an upward movement, the asset hits resistance at strikes where Call OI exceeds Put OI, as Call sellers defend that “ceiling”.
Hence summarizing the above three points we can state that,
- While OI shows outstanding commitment, volume shows the active energy of the current session.
- Strike price with highest OI or Volume on its Call side will act as a resistance and conversely a strike price with highest OI or Volume on its Put side will act as a support. When both are aligned at the same strike it gives better reliability.
- When highest Vol and OI are at two different strikes the one nearer to the ATM will act as the Resistance or Support.
- A Support or Resistance level marked by highest Volume is more reliable than one marked by highest OI. The OI may reduce as writers may migrate their position further to mitigate their losses if the trend in the underlying script is against them. This would result in the crumbling of the Support or Resistance created by OI. However, volume would never be reduced within a trading session and hence price is expected to give a positive reaction at those levels.
- Change in OI (COI) acts as temporary hurdle or immediate support or resistance. Such levels would hold the underlying at certain levels until the sellers have repositioned their positions to in cooperate the expected move.
- High volume accompanied by a significant Change in OI signals that “Big Money” is actively building or defending a level today.
3. Impact of Expiration Dates on Key Levels
As we approach the weekly or monthly expiry the structural dynamics shift rapidly:
-
Max Pain: This is the strike price where the greatest number of options would expire worthless. Institutional sellers—who want to retain the maximum amount of premium—often attempt to “pin” the index near this level as expiry approaches because it is the point where they lose the least amount of capital.
-
Gamma Acceleration: Near expiry, Gamma risk spikes for At-the-Money (ATM) options. If the index breaches a major Put Wall on expiry day, it can trigger panic. Institutional call sellers “panic” and cover their strikes, forcing them to buy back contracts to close their positions. This triggers a Gamma Blast (or rapid short-covering rally), where premiums swing violently by hundreds of points in a matter of minutes.
4. Using Option Chain Analysis to Determine Price Targets
By analyzing the distribution of OI, traders can identify a clear “Trading Corridor”:
The Lower Bound: The strike with the highest Put OI cluster serves as a realistic downside price target during corrections.
The Upper Bound: The strike with the highest Call OI cluster serves as the upside target for rallies.
Narrowing Ranges: If you see OI building up at strikes closer to the ATM level, it suggests that institutions expect a period of consolidation or range-bound movement.
5. Role of Key Levels in Option Trading Strategies
Institutional-grade strategies are built around these “walls” rather than raw direction to exploit mathematical probabilities:
Credit Spreads: For non-directional option sellers, identifying these walls allows you to safely execute Bull Put Spreads or Bear Call Spreads outside of these key institutional levels, allowing you to systematically exploit Theta Decay with a high probability of success while keeping risk defined if a wall is breached.
Iron Condors: This strategy involves selling both a Call spread at resistance and a Put spread at support. It is a “Vega-Neutral” play designed to capture premium as long as the index stays within the identified institutional corridor.
Practical Takeaway: The Pitfall of the Static Wall
-
The Common Pitfall: Many retail traders look only at the total cumulative Open Interest (OI) and assume a “wall” is an unbreakable barrier. They locate a major Put Wall on Monday morning and blindly buy calls or go long the moment price touches that level on Wednesday afternoon, failing to check if the underlying foundation has changed.
-
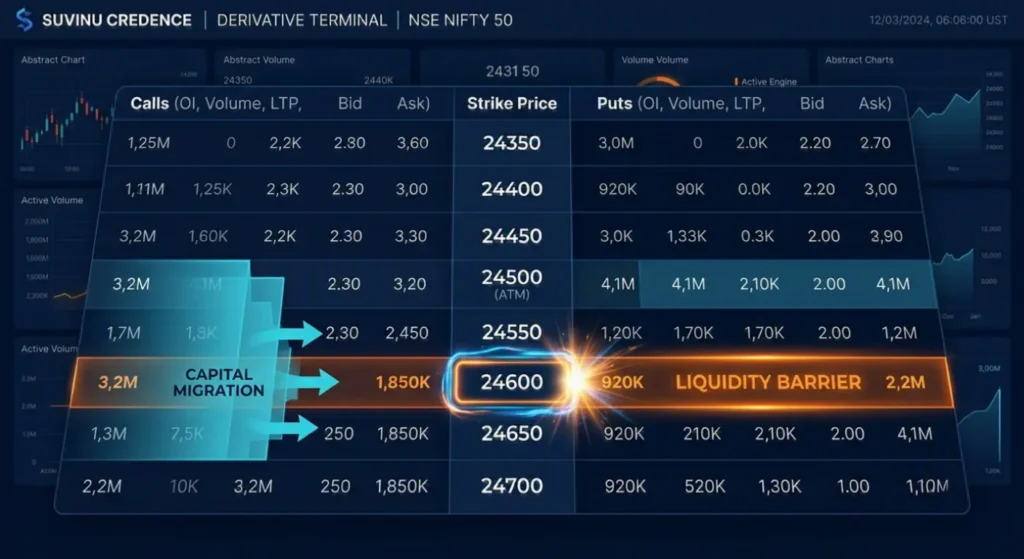
The Suvinu Pro-Tip: Never view volume or total OI in isolation. Always prioritize the Change in OI alongside Volume. Total OI tells you where the walls were built; Change in OI and Volume tell you where the “Big Money” is moving capital right now. If Market drops toward a major Put Wall, but you see a sharp decline in Put OI accompanied by rising volume and an accelerating spike in Call OI at closer strikes, the wall is crumbling. The smart money is moving out of the way—signaling a breakout or breakdown rather than a reversal.
This is Part 3 of our 10-part series on Option Chain Analysis. Stay tuned for our next post where we dive into Pillar 4: Implied Volatility and IV Rank to understand the “fear premium” and how IV Crush impacts your capital.
At Suvinu Credence, we believe that data-backed discipline is the key to long-term wealth. Explore our services to see how we simplify complex market data for your trading journey.