
Pillar 2: Option Greeks – The Radar for Institutional Positioning
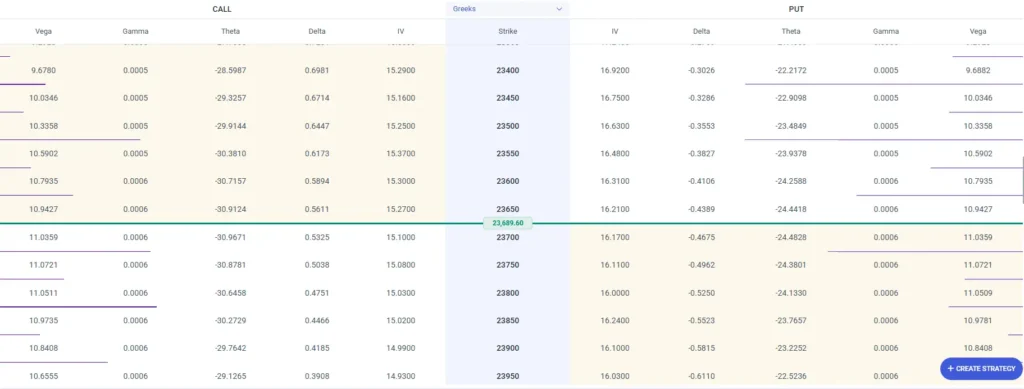
In our first post, we established that the option chain is not merely a data matrix but a real-time map of institutional “Big Money”. Understanding the physical layout of the National Stock Exchange (NSE) chain and the concept of Moneyness provided the “what” of the market. Today, we transition to the “why”—the mathematical drivers known as the Option Greeks.
The "Why": The Institutional Radar for Risk Management
At Suvinu Credence, we do not view option premiums as random numbers. They are the result of specific market forces—price, time, and volatility—quantified by the Greeks. For a disciplined institutional seller, Greeks are the radar system that reveals hidden exposures. While retail buyers often focus only on the Last Traded Price (LTP), professional writers use Greeks as “checkpoints” to manage their capital and ensure their directional and time-based risks are strictly controlled.
Understanding the Greeks: The Five Pillars of Risk
Options are dynamic contracts, and their premiums react constantly to several variables. To navigate the Indian derivative markets like Nifty or Bank Nifty, you must master these five metrics:
1. Delta (Price Sensitivity)
Delta measures how much an option’s premium will change for every ₹1 movement in the underlying index.
- Sellers use Delta to gauge the “directional risk” of their position.
- The Math: Call options have a positive Delta (0 to 1), while Put options have a negative Delta (-1 to 0). An At-the-Money (ATM) option typically has a Delta near 0.50. Delta value increase as they you move towards ITM and reduces as you more towards OTM
Example: If Nifty is at 24,000 and you sell an ATM call with a 0.50 Delta, a 100-point rise in the index will theoretically increase the premium by ₹50, resulting in a mark-to-market (MTM) loss for you as the seller.
Delta Migration Within the Option Chain
At ATM, the market is essentially undecided, resulting in a Delta near 0.50 for Calls and -0.50 for Puts. This means that the contract has roughly a 50% chance of expiring “in the money”.
As you move into the shaded regions of the NSE option chain toward In-the-Money (ITM) strikes, the Delta value increases.
- Call Options: Delta climbs from 0.50 toward 1.0.
- Put Options: Delta moves from -0.50 toward -1.0.
Deep ITM options behave almost exactly like the underlying index (behaving like a futures contract). Institutional sellers typically avoid writing these naked because the “Rupee Sensitivity” is too high; for every 1-point move in the index, your capital swings by nearly the full value of the market lot.
As you move into the unshaded regions toward Out-of-the-Money (OTM) strikes, the Delta value decreases.
- Call Options: Delta drops from 0.50 toward 0.
- Put Options: Delta moves from -0.50 toward 0.
These are the primary tools for the “Big Money”. Low-Delta OTM options (e.g., Delta 0.20 or 0.15) represent a lower mathematical probability of being breached, allowing sellers to focus on harvesting Theta Decay. However, remember that while the “price sensitivity” is low, these contracts carry Gamma risk—their Delta can spike violently if the market makes a sudden move toward that strike.
Summary of Delta Migration
|
Direction from ATM |
Call Delta |
Put Delta |
Institutional Context |
|
Deeper ITM |
Approaches 1.0 |
Approaches -1.0 |
High directional risk; “Future-like” behavior. |
|
At ATM |
Near 0.50 |
Near -0.50 |
The “Battleground”; 50/50 probability. |
|
Further OTM |
Approaches 0 |
Approaches 0 |
Probability of expiring worthless is high; used for premium collection |
What is Net Delta?
Net Delta is the most critical metric for understanding a portfolio’s aggregate directional risk. While retail traders often focus on individual trade profits, institutional “Big Money” manages the entire portfolio by calculating how much the total portfolio value will swing for every 1-point move in the index.
To calculate the Net Delta for your whole portfolio, follow this institutional protocol:
- Identify Individual Deltas
First, you must pull the real-time Delta for every option position you hold from the option chain. For future positions determine whether the delta is -ve or +ve basis whether we hold a short or long position in Futures.
- Calls: Have a positive Delta ranging from 0 to 1.
- Puts: Have a negative Delta ranging from -1 to 0.
- Futures: Always have a Delta of 1.0 (positive for Long, negative for Short).
- Determine Unit-Level Exposure (Directional Bias)
Because you may be buying or selling (writing) these contracts, you must adjust the sign of the Delta based on your position:
|
Instrument |
Long Position |
Short Position (Seller) |
|
Call Option |
+ Delta |
– Delta |
|
Put Option |
– Delta |
+ Delta |
|
Future |
+ 1.0 |
– 1.0 |
Note: As an institutional seller, if you write a Put, you accumulate positive Delta because you profit if the market rises.
- Factor in the Lot Size (Rupee Sensitivity)
Individual Delta values are “per unit.” To understand the impact on your capital, you must multiply the unit Delta by the Market Lot size [Source 6, 349, 355].
- Nifty 50: 65 units per lot [Source 349, 356, 583].
- Bank Nifty: 30 units per lot.
- Formula: Position Delta = (Unit Delta) × (Lot Size) × (Number of Lots).
- Sum to Find the Net Delta
Add all the values together to find your aggregate exposure. This shows your “Net Directional Bias”.
Calculation Example (Nifty Portfolio):
- Position A: Short 2 lots of Nifty Futures (Delta -1.0 per unit).
- Calculation: (-1.0) × 65 × 2 = -130 Delta.
- Position B: Long 2 lots of ATM Call Options (Delta 0.50 per unit).
- Calculation: (+0.50) × 65 × 2 = +65 Delta [Source 349, 504].
- Total Net Delta: -130 + 65 = -65.
Interpretation: This portfolio is still “Net Bearish”. For every 1-point rise in Nifty, the portfolio theoretically loses ₹65 in mark-to-market (MTM) value.
What is Delta Hedging?
Delta Hedging is the process of adjusting a position so that its overall Net Delta remains near zero. Delta measures how much an option’s premium changes for every ₹1 move in the underlying index. By balancing positive and negative deltas, a trader creates a position that is “directionally neutral,” meaning the portfolio’s value remains relatively stable regardless of small market moves.
How Institutions Use Delta Hedging?
Institutional desks and professional option sellers use this technique to adopt a defensive posture, particularly in high-volatility environments. Their primary applications include:
- Neutralizing Directional Exposure: If an institution sells a large number of Call options, they accumulate “Negative Delta,” meaning they lose capital if the market rises. To hedge this, they may buy index futures (which have a Delta of 1.0) to bring the net exposure back to zero.
- Focusing on Theta Decay: By removing the worry of whether the market goes up or down, institutions can focus purely on collecting Theta Decay (the daily “rent” paid by option buyers).
- Volatility Harvesting: In scenarios like an expected IV Crush, institutions use delta-neutral strategies (such as Short Straddles) to profit from the collapse in premiums rather than betting on a specific price direction.
- Managing Portfolio Breadth: Professional traders monitor the aggregate Greeks of their entire portfolio to ensure their “Net Delta” stays within strictly defined capital risk limits.
The Necessity of Re-Hedging (The Gamma Factor)
A critical institutional insight is that Delta is not static; it changes constantly as the underlying index moves. This change is governed by Gamma, which acts as the “acceleration” of Delta. Because of Gamma, a position that is perfectly neutral at one price level can quickly become directionally exposed if the market moves significantly. Consequently, institutions must constantly re-hedge—buying or selling futures or options—to re-balance their scales and maintain neutrality .
In the live markets, managing a portfolio’s delta isn’t just about picking direction—it’s about structural risk management. Sophisticated options trading requires a deep understanding of how these mathematical boundaries shift in real-time. At Suvinu Credence, we help investors bridge the gap between complex data and disciplined execution.
2. Theta (Daily Rent)
Theta is the Option Greek that measures time decay—the expected decrease in an option’s premium for each passing day, assuming the underlying index price and volatility remain constant. It represents the erosion of the “time value” (or extrinsic value) component of an option’s total price. At its core, Theta can be thought of as the daily “rent” or “insurance premium” that an option buyer pays to the seller for the right to hold the contract.
How Theta Decay Works?
Theta decay is the process by which an option’s time value bleeds away as it approaches its expiry date. It is critical to understand that this decay is not linear:
- The Acceleration Curve: When there is significant time remaining (e.g., 30–45 days to expiry), the decay is relatively slow. However, as the contract nears its expiry, especially in the final week, the rate of decay accelerates sharply.
- The Expiry Impact: For At-the-Money (ATM) options, Theta becomes extremely aggressive in the final hours of trading. On a quiet expiry morning, an ATM call can lose up to 40% of its value simply because the index remains stationary while the “clock” runs out.
OTM vs. ITM: Out-of-the-Money (OTM) options consist entirely of time value; therefore, if the index does not reach the strike price by expiry, Theta will eventually reduce their premium to zero.
Why Theta is the "Seller's Friend"?
In the institutional world of the “Big Money,” Theta is the primary reason why selling options is often more mathematically favorable than buying them.
- Guaranteed Income Stream: While market direction is uncertain, the passage of time is guaranteed. For an option seller, Theta is positive, meaning they “collect” the premium that the buyer loses each day.
- Profit in Sideways Markets: Unlike option buyers who generally need a sharp directional move to overcome time decay, sellers can profit even if the Nifty 50 or Bank Nifty stays flat or moves slightly against their position.
- Institutional Harvesting: Professional desks use neutral strategies, such as Short Straddles or Iron Condors, specifically to “harvest” this accelerating Theta decay in low-volatility environments.
The “Rent” Collection: As the contract draws closer to expiry, the mathematical probability of an OTM option becoming valuable decreases, allowing the seller to pocket the daily “rent” until the contract expires worthless.
3. Vega (Volatility Sensitivity)
Vega measures the sensitivity of the premium to a 1% change in Implied Volatility (IV).
When market fear spikes (rising India VIX), premiums inflate, which is often an ideal time for institutions to sell. Before high-impact events—such as RBI policy announcements, Union Budgets, or corporate earnings—uncertainty and fear drive traders to buy options as “insurance,” which inflates premiums. Once the outcome is known and the uncertainty is resolved, the “fear premium” evaporates, causing option prices to drop sharply even if the underlying index has not moved significantly, often referred to as IV Crush.
What is IV Crush?
IV Crush is one of the most powerful tactical advantages for an option seller, provided it is managed with data-backed discipline.
IV Crush refers to a rapid and significant collapse in an option’s Implied Volatility (IV) immediately following a major market event. Before high-impact events—such as RBI policy announcements, Union Budgets, or corporate earnings—uncertainty and fear drive traders to buy options as “insurance,” which inflates premiums. Once the outcome is known and the uncertainty is resolved, the “fear premium” evaporates, causing option prices to drop sharply even if the underlying index has not moved significantly.
The Impact on Option Sellers
For the institutional “Big Money,” high IV represents an opportunity to sell overvalued “insurance” contracts.
- Premium Harvesting: Option sellers benefit directly from an IV Crush because they collect high premiums when volatility is peaking and aim to buy those contracts back at a much lower price once volatility subsides. This process is often referred to as “harvesting” the volatility premium.
- Vega Sensitivity: The impact of IV Crush is quantified by Vega, the Greek that measures a premium’s sensitivity to a 1% change in IV. In high-volatility regimes, institutional desks monitor Vega to determine if premiums are “expensive” enough to justify the risk of selling.
Neutralizing Directional Risk: Because the drop in premium from an IV Crush can be so substantial, it can sometimes offset losses if the market moves slightly against the seller’s directional view. This allows sellers to employ neutral strategies, like Short Straddles or Iron Condors, to profit purely from the volatility collapse rather than price movement.
Risks for the Seller: The Pre-Event "Vega Spike"
While the “Crush” is profitable, the period leading up to the event is hazardous for sellers.
- Mark-to-Market Losses: As an event approaches, IV often continues to rise, which increases option premiums. A seller may experience significant mark-to-market (MTM) losses during this “Vega spike” even if the index remains range-bound.
The X-Factor: Sudden geopolitical shocks can cause “Vega shocks”—unexpected spikes in fear that inflate premiums and can wipe out several days’ worth of Theta Decay gains in seconds.
When implied volatility spikes, retail traders often panic, while institutional players adjust their positioning to capture mispriced premium. To trade volatility successfully, you need institutional-grade data and a robust trading infrastructure.
[Click Here to Onboard and Activate Your Trading Account in 5 Minutes]
4. Gamma (Delta's Acceleration)
Gamma measures the rate of change of Delta for every ₹1 move in the underlying index.
Gamma is the “risk multiplier”. Near expiry, ATM options experience a Gamma Blast, where small index moves cause massive, unpredictable swings in premium, making naked writing extremely hazardous.
What is Gamma Blast?
As an option approaches its expiry, Gamma—which measures the rate of change in an option’s Delta—spikes significantly for At-the-Money (ATM) contracts. This is known as a Gamma Blast because even a minor movement in the Nifty or Bank Nifty can cause the option premium to swing by hundreds of points in minutes. While this volatility is exciting for buyers, it is the single greatest threat to a disciplined option seller.
Strategic Framework to Avoid Gamma Risk
To navigate the final hours of a derivative cycle without suffering catastrophic mark-to-market (MTM) losses, follow these institutional protocols:
The “T-Minus 5” Rule: The most effective way to avoid the blast is to simply not be in the path of the explosion. Professional institutional desks typically exit or roll over their positions 5 to 7 days before monthly expiry. Some strategies even suggest exiting 3 to 5 days prior to avoid the extreme Theta Decay and Gamma acceleration that characterize the final 72 hours.
Averaging the ATM “Battleground”: Avoid selling naked ATM options on expiry day. Because Gamma is at its peak for ATM strikes, they become “legitimately chaotic” during the final 60 minutes of trade. If you must trade, stick to further Out-of-the-Money (OTM) strikes where Gamma is lower, though these carry their own risks if the market trends aggressively.
Transition from Naked to Defined-Risk: If you intend to hold a position closer to expiry, convert naked short positions into defined-risk spreads, such as Bull Call Spreads or Iron Condors. By buying a “protection leg,” you cap your maximum potential loss and neutralize a significant portion of the Gamma acceleration.
The 2:30 PM “No-Fly Zone”: In the Indian markets, the window from 2:30 PM to 3:30 PM on expiry day is when the Gamma Blast is most potent. During this time, institutions are squaring off massive positions, causing the index to oscillate violently. Retail traders should treat this as a “no-fly zone” for new entries and a mandatory exit window for existing short ATM positions.
5. Rho (Interest Rate Sensitivity)
Rho measures how much a premium changes with a 1% shift in interest rates.
While vital for long-term LEAPS, Rho’s impact is generally negligible for the weekly and monthly contracts that dominate the Indian market.
The Pitfalls of a Retailer:
- Many retail traders assume Delta remains constant throughout the day, leaving them blind to portfolio exposure drift as the underlying market trends.
- Retail traders buy “cheap” OTM options near expiry without realizing that Theta is their greatest enemy during that window, often eroding their capital even if they get the market direction partially right
- A common mistake most retail sellers commit is entering a trade too early before an event, only to be forced out by a rising India VIX
Practical Takeaways: The Pro-Tips
- Open your Angel One trading account for modern trading platforms that provide real-time Greek values directly alongside the their strike price in option chain.
- A professional trader looks at the Net Delta of their entire portfolio.
- Institutional sellers adopt a “defensive posture” to protect their capital. ·By maintaining a Net Delta-neutral position, institutions can minimize the impact of price fluctuations in indices like Nifty or Bank Nifty and focus on harvesting other profit sources. Institutional “Big Money” often neutralise the directional risk of their option portfolios by utilising the sophisticated risk management strategy known as Delta Hedging.
- Professional desks monitor Delta Drift daily. Because Gamma constantly changes your Delta as the index moves, a position that was neutral in the morning may become directionaly exposed by the afternoon.
- Never assume a position is safe just because it is OTM on the morning of expiry. A Gamma Blast can turn an OTM option into an ITM option in a matter of seconds. Always set a hard stop-loss based on the premium’s price sensitivity (Delta) rather than just the index level to ensure you are automatically “taken out” of a trade before a Gamma-driven move wipes out your capital.
- Always monitor your Gamma Risk as expiry day approaches. In the final hours of trading on expiry day, ATM strikes become “legitimately chaotic” due to Gamma blast, where premiums can swing by hundreds of rupees in minutes. Professional sellers typically exit or convert to defined-risk spreads well before this window to avoid being wiped out by a sudden move.
- Professional institutional desks often wait for IV Rank or IV Percentile to reach extreme levels before entering a short volatility position.
Don’t let advanced analytics go to waste on a sub-par trading platform. Partner your market knowledge with Angel One’s premier trading infrastructure, fully backed by the dedicated, professional guidance of Suvinu Credence.
[Click Here to Onboard and Activate Your Trading Account in 5 Minutes]